To view your Merchant's profitability go to the Merchant Details page and click on the dollar icon next to the MID number:

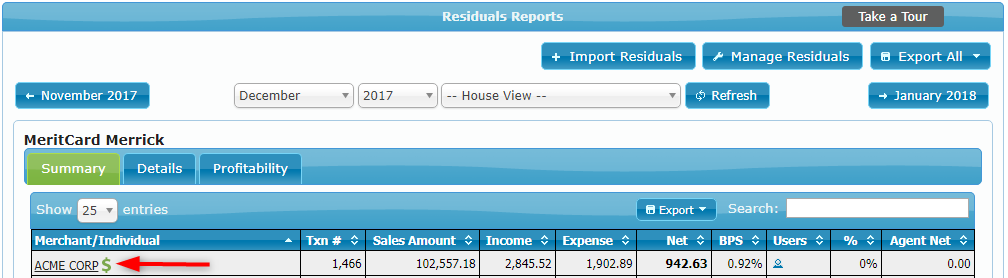
You can also view a Merchant's profitability by clicking on the dollar icon on the Residuals report for that merchant:
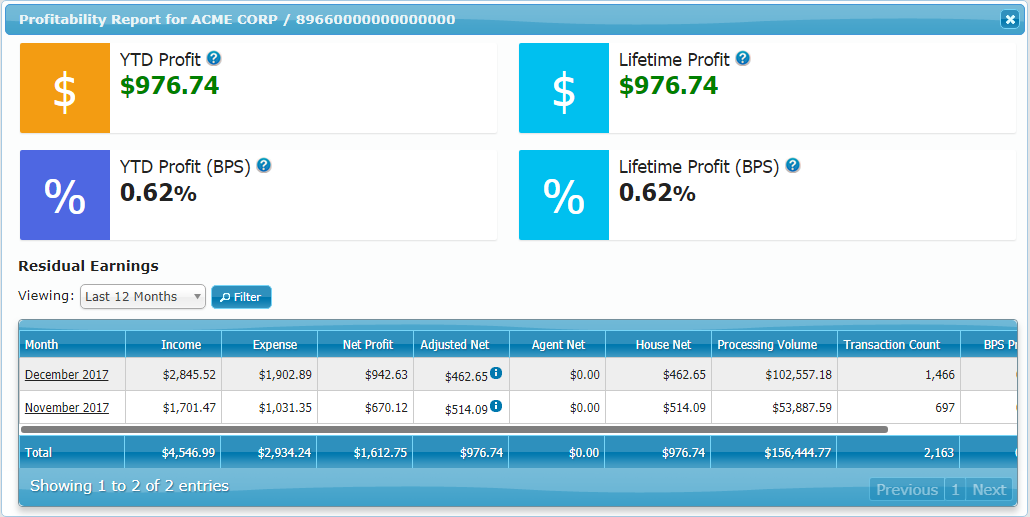
The Merchant profitability report displays the following data:
- Year-to-date profit in dollars and basis-point-percentage (BPS)
- Lifetime profit in dollars and BPS
Here is an example of a Merchant profitability report:
In order to view the profitability information for the entire Processor, open the Profitability tab on the Residuals page:
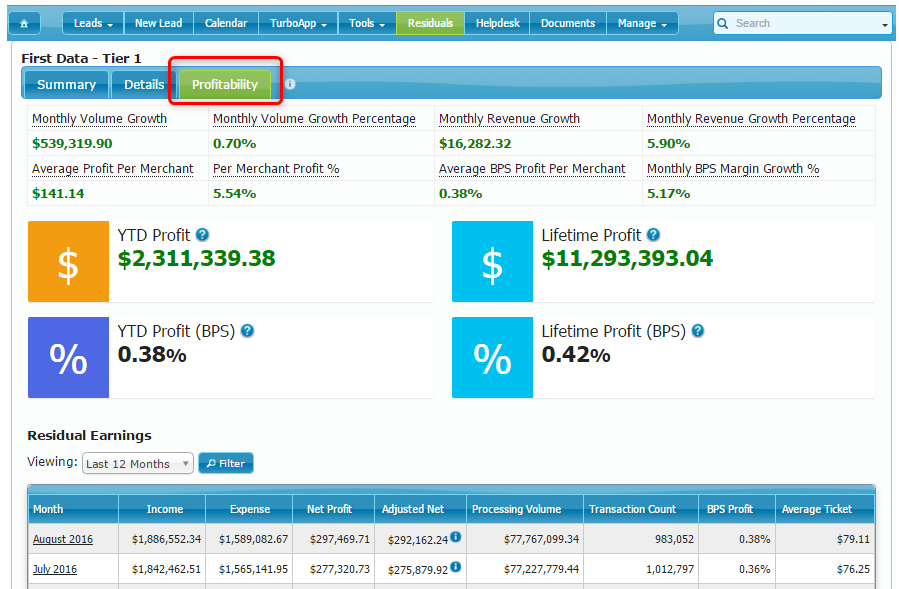
The Processor profitability report displays the following data:
- Monthly Volume Growth in dollars and as a percentage
- Monthly Revenue Growth in dollars and as a percentage
- Average Profit per Merchant in dollars, BPS and as a percentage
- Monthly BPS Margin Growth as a percentage
- YTD Profit in dollars and BPS
- Lifetime Profit in dollars and BPS
The full history of profitability is shown on both the Processor and the Merchant level, in the Residual Earnings report. You will be able to see following information:
- The Month
- Income
- Expense
- Profit
- Adjusted Income
- House Net
- Processing Volume
- Transaction Count
- BPS Profit
- Average Ticket
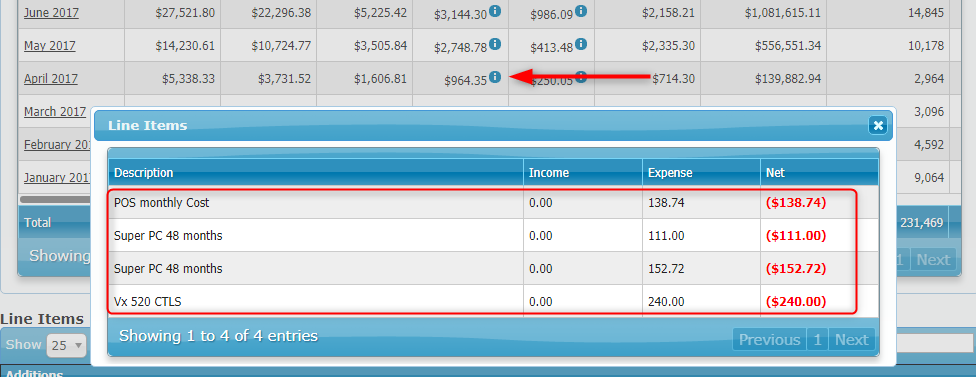
By clicking on the Info icon in the Adjusted Net column in the Residual Earnings report, the line items that were used to calculate this dollar amount will become visible (including any manually added line items):
Top Questions:
1. What is Profit? Is that before or after user payouts are done?
Profit is the Adjusted Net, which is after Line Items but prior to agent payouts.
2. What is the formula for calculating BPS Profit?
BPS Profit is the Adjusted Net divided by the Processing Volume.
3. What is the difference between Net Profit and Adjusted Net?
Net Profit is the net income for the ISO, equal to the Income minus the Expenses on the Summary tab. It is equal to the Net column in the Summary tab, which includes calculations from Templates.
Adjusted Net is the Net Profit minus Line Items that are attributed to the merchant(s).
4. How are the Volume and Revenue Growth Percentages calculated?
Take the Growth amount and divide it by the previous month’s amount.
User Class Permissions:
- Portfolio Activity Monitoring - Merchant Profitability
- Merchant Profitability with Unpublished Reports
- Residual Reporting - Residuals Profitability
The difference in the first two permission options listed above is that Unpublished Reports will include all uploaded residuals reports when doing calculations, whereas the standard permission will only use those marked as Visible on the Imported Residual Reports page.
Scenarios based on User Class Permissions:
A user has Merchant Profitability but not Residuals Profitability:
- No Profitability tab is visible on Residuals.
- A user can get to merchant profitability by clicking the dollar icon next to a merchant name.
- A user can see the profitability icon on the merchant profile.
- A user can get to the merchant's profitability page by clicking the dollar icon.
A user has Residuals Profitability but not Merchant Profitability
- A user can see the Profitability tab, but there are no dollar icons next to the merchants' names.
- A user can navigate to the Profitability tab for the portfolio.
- A user does not see the dollar icon on any of the merchant profile pages.
A user has Residuals Profitability and Merchant Profitability
- A user can see the Profitability tab and the dollar icon next to each merchant on the residuals page.
- A user can navigate to the Profitability tab.
- A user can get to merchant profitability from clicking on the dollar icon from the residual report as well as from the merchant profile.
A user does not have Residuals Profitability or Merchant Profitability
- A user does not see Profitability tab or the dollar icon in the residual report view.
- A user does not see a dollar icon in the merchant view.